How to host the perfect house party… according to Brits

As we dive into the heart of the festive season, the air is filled with anticipation for Christmas and New Year’s, marking the onset of a flurry of celebrations and gatherings.
For the hospitality sector, there is a significant uptick in bookings from groups and businesses for parties. However, Christmas and New Year’s are synonymous with hosting or attending house parties.
With the height of the COVID-19 pandemic a distant memory for most, there’s been a noticeable shift, with nearly a quarter of Brits confessing to attending more house parties in 2023 compared to the previous year but according to Google data, it is during December and early January when searches for house party-related terms soar.
But what is required to host the perfect party?
That’s the question we have attempted to answer to celebrate the launch of our first retro drinkers cooler with our new Nancy range (more about that at the bottom of this article).
We recently conducted a national survey of people between the ages of 16 and 55+, with the help of Censuswide, to find the answer and discover what people most want to see at a house party:
An unsurprising disclaimer: the answer is not straightforward.
Brits house party preferences by city
With our survey, we have been able to discover what the most desired house party requirements were per city. As part of this, we looked into what the most popular party persona of that city was but also delved into what the most popular food, drink, and music choices were.And here’s what we found:
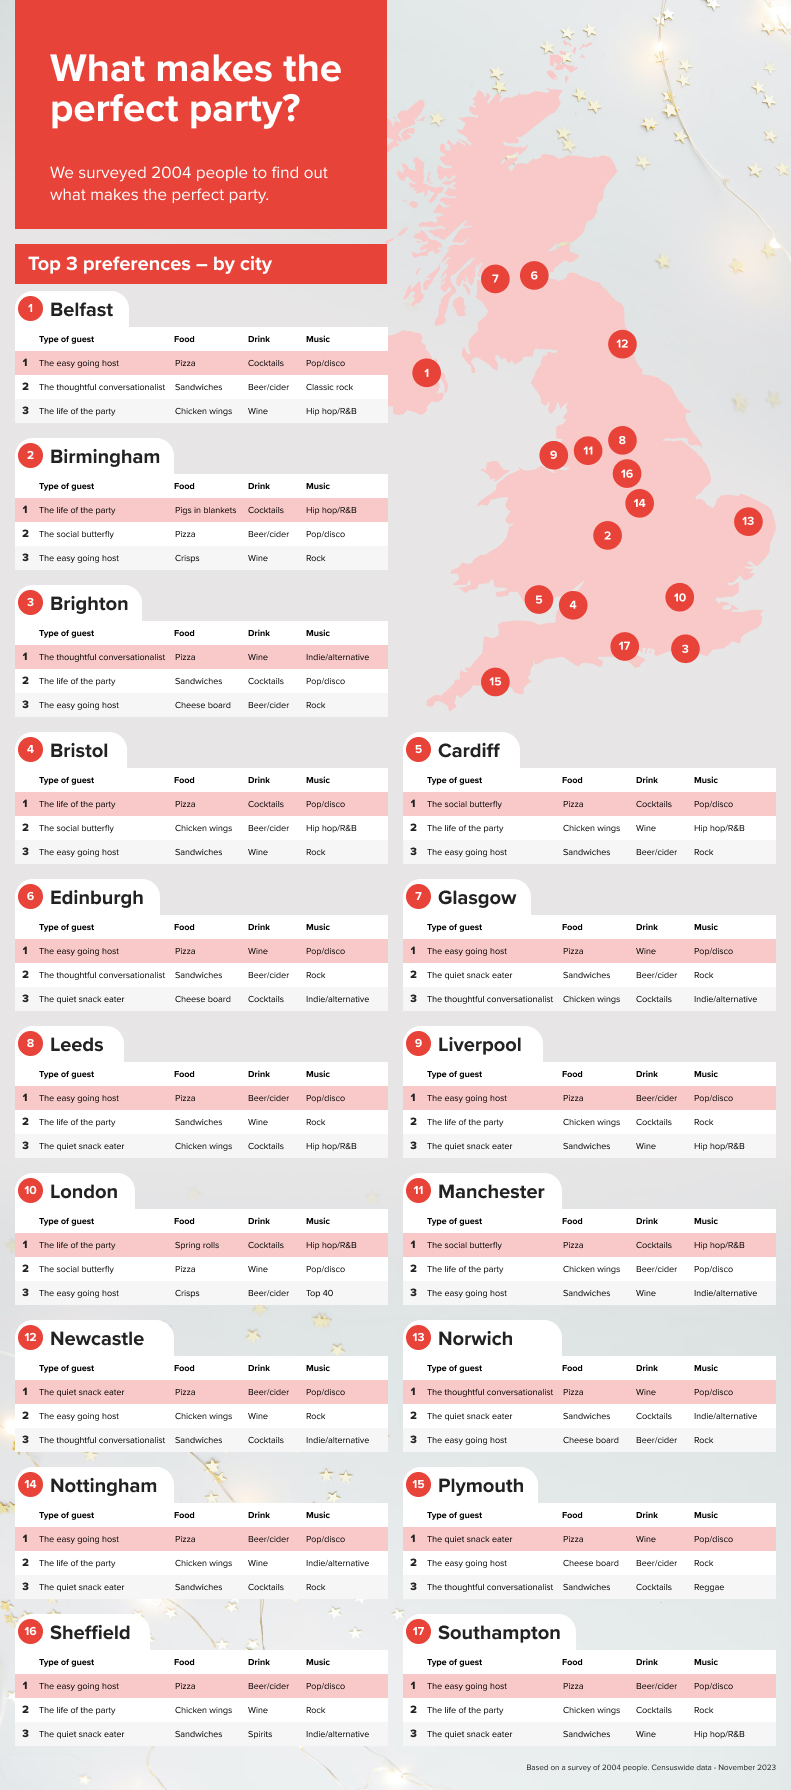
Some of the key highlights we found include:
| Food highlights | Drink highlights | Music highlights | Party preferences |
| Northern Ireland had the highest preference for pigs in blankets (37%), compared to other cities | Bristol loves to see cocktails at their house parties more than any other UK city (40%) | London showed more preference for hip hop and R&B as their choice of music than any other city (27%) | Music was more important to people in Bristol than any other UK city when it came to house parties |
| Sheffield had the lowest preference for pizza (30%) | London prefers wine, cocktails, and even soft drinks over beer and cider | While pop and disco hits were the overwhelming top choice of music, Nottingham had the lowest preference for it (32%) | While good food was important everywhere, it scored the lowest number of votes in Norwich, where more emphasis was put on music and drinks |
| Cardiff party-goers scored the lowest when it came to wanting to see sandwiches on the buffet table (36%) | 15 of the 17 cities we surveyed highlighted non-alcoholic beverages as the drinks option they’d least like to see at a house party. Brighton was the only city that didn’t give non-alcoholic drinks a single vote | While London loves hip-hop and R&B, Glasgow doesn’t with only 7% picking it as their music of choice at parties | Party favours and an order of events was the least sought-after thing from house parties, although London showed the highest preference for them than any other city |
Assessing the data, Holly Bolus, a lifestyle expert at CDA Group, said: “While those statistics caught the eye, they were clear winners across all of the preferences that can help us understand what it is people want to see when they go to house parties.
“On a very top level, it’s not surprising that music, food, and drinks are seen as the staples of a good party. It’s been interesting to see how that has broken down by the different age groups but also the different ways people identify themselves in a party environment.
“It’s also important to say that we had an overwhelming response in our survey that highlighted the importance of a good guest list, too.”
How the top five UK cities compare
London – estimated population: 10,803,000- Outside of most popular choices, Londoners scored the biggest percentage for wanting hip-hop and R&B, soul and funk classics, and reggae for their house parties
- That said, Londoners had the lowest preference for wanting to listen to the Top 40 charts and Indie music
- While wine and cocktails were the drink of choice in London, respondents also showed they had the lowest preference for wanting beer and cider at a house party
- London had the biggest percentage of people who described themselves as the life of the party, as well as party planning extraordinaire, and the karaoke king/queen
- Life of the party or not, responding Londoners were least likely to want a theme at their house party
- Has overwhelming popularity for pop and disco hits for their music choice, with a bigger percentage gap between that and its next best choice out of the top five cities
- However, Brummies were also least likely to want to listen to classic rock anthems, classical, or jazz at a house party
- When it came to drinks, Birmingham also were least likely to want wine or cocktails, with their preferences, instead, being on beer, cider, and spirits
- It also turned out Birmingham party goers had the highest preference for cheese boards, spring rolls, and mini cheesecakes than any of the other big five cities in this list
- Don’t introduce the games, though! Brummies had the lowest preference for interactive games, as well as party, favours
- Famous for its punk rock era, it turns out that Mancunians had the highest preference for Top 40 chart toppers at their house parties
- When it came to the top five cities, Manchester party goers identified most as an oversharer or crier at a house party. Manchester also topped the category of people who described themselves as the quiet snacker
- But while Mancunians topped that the quiet snacker category, they also scored the lowest preference for wanting a cheeseboard at a house party
- Manchester had the biggest preference for cocktails and mocktails out of the UK’s big five cities
- Yorkshire’s biggest city showed the highest preference for wanting chicken wings, pigs in blankets, trifle, and stuffed mushrooms at their parties
- However, on the other end of the scale, Loiners also had the lowest preference for mini cheesecakes, cup cakes, and macarons
- When it came to music choice, Leeds party goers had the highest percentage of people who wanted to listen to classical and jazz music at their house party, compared to the other four cities in this list
- Had the biggest percentage of people who claimed they attended parties as the supportive sidekick
- Respondents from Leeds showed they were least likely to want an attentive host when they attended a house party.
- While largely unpopular throughout the poll, Glaswegians actually had the highest preference for interactive games at their house parties
- Beer and cider was the overwhelmingly popular choice of drink for a house party but it turns out the Glaswegians, more than any of the other big five cities, other had a preference for tea and coffee
- Glaswegians are also very clear on what they don’t like, too. Glasgow showed the lowest preference for hip-hop and R&B as well as soul and funk classics
- Had the lowest preference for spring rolls and pigs in blankets, compared to the other four cities in this list.
- Only 1 person from Glasgow voted for trifle as a top three food choice at house parties
Five things to avoid at your house party
We all love a tick-list of what we need to have for a house party. And because it is such a subjective thing, it is easy to decide to get a bit of everything to ensure everyone is happy. However, if you just want to focus on what is going to keep the majority happy, here are a few tips to take on board:- Perhaps we will regret it the following day but forget the greens and healthy options. We’re attending a party to indulge
- Inclusivity is key to any successful party but Brits said that filling a limited bar with non-alcoholic options will ruin the vibe you’re going for
- Classical and jazz genre music is likely to have people heading for the door and not the dance floor
- Building a guest list? Brits say they want to avoid those whose emotions spill out after one too many and who are going to bring the mood down
- Forced fun isn’t fun. Put the games away – you only have to have watched Friends to know how this goes.
Creating the perfect house party for each age group
So, we have an idea of preference by city and what Brits don’t want to see at parties but how does this change when we’re hosting a party for a particular age group? As part of our survey, we asked questions to five different age ranges. They were: 16-24, 25-34, 35-44, 45-54, and 55+. Below, we have taken all five age groups and are revealing what they have told us their preferences are and what they want to see when they are attending a house partyAges 16-24
- Music is the most important party requirement, particularly pop and disco hits and hip & R&B genres. Avoid classical. Indie peaks with the age group and begins a gradual decline.
- Pizza is the overwhelming food of choice but having a bowl of crisps and chicken wings will go down a treat. Mini quiches, stuffed mushrooms, and trifle will be left behind
- Cocktails and soft drinks are the drink of choice. Avoid non-alcoholic beers. Wine also wasn’t a popular choice
Ages 25-34
- Music remains the most important party requirement, but food increases in importance for this age group. Party favours and an order of events, while still unpopular, peak in popularity here
- Hip-hop and R&B peaks in popularity with Brits aged between 25-34. Classical sees an increase in popularity but jazz and swing music is going to be a huge mood killer.
- There’s no change in food choices. Pizza, chicken wings, and crisps are still the most popular, while mini quiches, stuffed mushrooms, and trifle get left behind. We begin to see an increase in sandwiches and cheese boards.
- Cocktails are still the drink of choice. Soft drinks remain popular but beer and cider become far more popular for this age group. Non-alcoholic options remain unpopular.
Ages 35-44
- Good music and food grow in importance again. Party favours and an order of events are beginning to decline.
- There’s a clamour for popular pop and disco hits. Hip-hop and R&B remain popular but rock anthems have grown in popularity to become the third most popular music genre of choice.
- Yes, pizza again remains the food of choice with crisps and chicken wings. Sandwiches grow in popularity, as do pigs in blankets and spring rolls. Macrons, trifles, and stuffed mushrooms remain an unpopular food choice.
- Beer and cider is now the most popular choice of drink, closely followed by cocktails and spirits. There’s a go-hard or go-home mentality in play. You’re asking for trouble with mocktails and non-alcoholic beers.
Ages 45-54
- There’s almost nothing between the importance of music and food at this point.
- Popular pop and disco hits are the overwhelming choice of music. Classic rock anthems are now the second most popular choice, with top 40 chart toppers peaking in popularity.
- Pizza’s decline begins. It’s still the most popular choice but not by a lot. Sandwiches see a significant rise with chicken wings seeing a significant decline. Macrons, fruit skewers, and trifle are the least popular options, while mini cheesecakes also scored low.
- Beer and cider’s popularity grows again but party-goers in this age group want to see a varied selection available. Soft drinks are the second most popular option, but wine, cocktails, and spirits also feature highly. Less than 3% in this age group pick non-alcoholic beer as their drink of choice
Ages 55+
- After music’s dominance, food is now the most important factor behind a good house party. Music is still popular, as is drinks, but this age group wants to see an attentive host more than any other. Less than 5% of respondents in total want party favours and an order of events.
- Popular pop and disco hits remain the most popular choice of music by some distance. Classic rock anthems are also a clear second. Hip-hop and R&B is now the least favoured genre of music.
- Pizza has finally been knocked off the top spot. According to Brits aged 55 and over, pizza doesn’t even feature in the top three food choices. Sandwiches are the most popular, followed by cheese boards, and crisps. Cupcakes are at their least popular here but macrons, fruit skewers, and stuffed mushrooms remain unpopular.
- Wine peaks in popularity for Brits aged 55 and over. Beer and cider remain popular, as do spirits and soft drinks. Mocktails are the least popular with this age group.
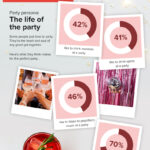
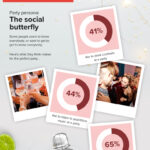
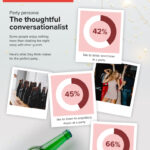
The party personas in more detail
More about the new Nancy range
Nancy heralds a departure from conventional refrigeration.Replacing bulky mini-fridges with an upright beautiful design and three colourway options – Cotton White, Tea Rose Pink, and Dark Skies Blue – CDA’s newest product effortlessly marries vintage aesthetics with contemporary demands. The device boasts top-of-the-line technical specifications, ensuring beverages inside are as refreshingly cool as the exterior suggests.
Functionality takes centre stage as Nancy effortlessly accommodates 13 bottles of wine and eight cans, chilling them to perfection at any temperature between 5-20°C. Its four spacious metal shelves cater to a variety of preferences, allowing enthusiasts to maximise their cooling space for an unparalleled experience.
But Nancy is more than a mere drink cooler – it’s a beauty enhancer, too. Ingeniously designed, it doubles up as a cosmetics cooler, storing makeup and beauty products at the ideal temperature.
Moreover, embracing the digital age, Nancy incorporates a wireless phone charger, seamlessly blending modern technology with vintage aesthetics.
Nancy is available now for order in Cotton, Tea Rose, or Dark Skies from CDA’s independent and national stockists, including AO, Marks Electrical, and selected Euronics, with a suggested retail price of £399. A full list of retailers can be found here.
Find out more about CDA’s newest retro lifestyle cooler here.
Methodology
This data was gathered via a national Censuswide survey that was completed at the beginning of November (6th-8th). The full data set can be found here.